This is an archived article that was published on sltrib.com in 2017, and information in the article may be outdated. It is provided only for personal research purposes and may not be reprinted.
The Utah Transit Authority decided to compare itself with similar agencies nationwide and found that it is among the best for holding down costs, but it sits near the bottom for attracting riders.
Even worse, its ridership recently has been dropping, not improving.
"One of the things we've focused on is being efficient. So that shows in the numbers," said Bob Biles, UTA vice president of finances, who prepared the comparison as part of an annual financial report to UTA's board. "We do fall lower" on ridership, he conceded.
While UTA seeks to improve ridership, he said, it may not be able to make great strides unless voters approve higher sales tax rates needed to do such things as offer more weekend and night service, improve reach into neighborhoods and increase frequency.
"With our current resources, we're going to be limited for a while," he said. "It's up to elected officials and to the voters if they want to provide us with additional revenues to provide greater service."
The report by Biles compared 2016 costs and ridership data with 17 other similarly sized agencies nationally for bus service, 10 others for commuter rail service and nine others for light rail service.
—
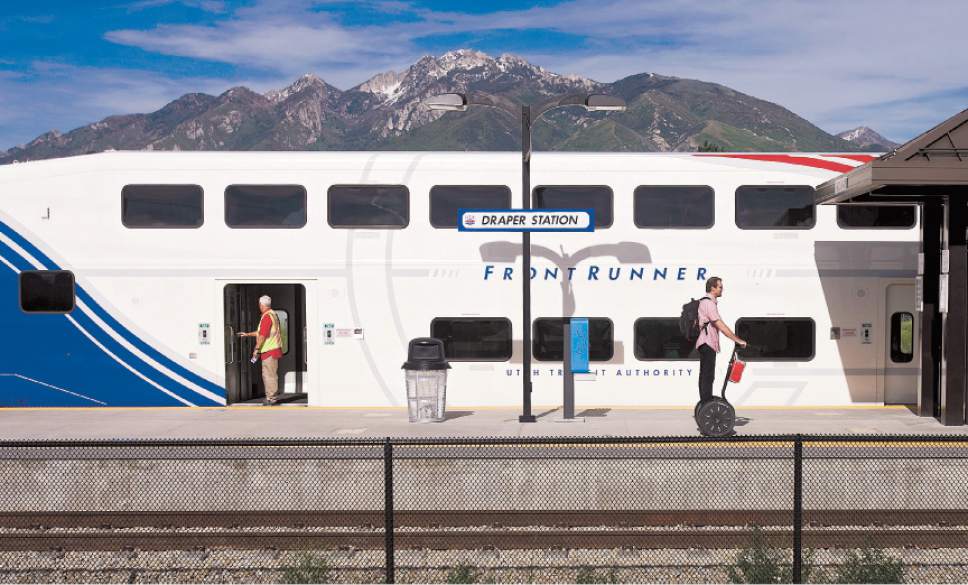
Ridership • UTA ranked second-worst for its bus and FrontRunner commuter-train ridership. It was a bit better on its TRAX light rail — either third or sixth worst, depending on the measure used.
Specifically, in 2016, UTA had 1.4 bus passenger boardings per mile of operation — less than half the average of 2.22 among the 18 agencies used in those comparisons. The only one with fewer was DART in Dallas.
Measured another way, UTA had 19.5 bus passenger boardings per hour of vehicle operation — 39 percent lower than the average of 27.1 among sister agencies. Again, only the agency in Dallas was lower.
Similar findings came for FrontRunner. It had 0.9 passenger boardings per mile of service (compared to an average of 1.46 by similar agencies) and 30.1 per vehicle hour of service (compared to an average of 48.5). Only service operated by Albuquerque, N.M., ranked lower in both measures.
Ridership on TRAX was a bit better.
TRAX attracted 3 passenger trips per mile — more than double the number on UTA bus or FrontRunner, but still below the average of 3.96 among other agencies for light rail. It was third lowest among 10 agencies compared.
It had 56 trips per vehicle hour of operation, a bit below the average of 61.07 of all agencies compared. That was sixth lowest of the 10 agencies compared.
Biles said the better ridership on TRAX is one reason UTA accelerated expanding that system 15 years earlier than planned. "It's in the more dense areas" for population, which is one reason ridership is higher, "and it's relatively low cost" — which helps offer more frequent service.
However, borrowing to accelerate building the rail systems has created so much debt that UTA currently spends more on debt service each year than on bus service.
—
Declines • At the same time that UTA's ridership ranks low compared to other agencies, ridership has been dropping even more recently.
The number of its total passenger trips decreased from 46.7 million in 2015 to 45.5 million last year, down about 2.6 percent.
Through April of this year, ridership was down slightly — 0.8 percent — compared to 2016. Biles said preliminary numbers through May showed that ridership was essentially flat this year.
Biles notes that transit ridership has been down the past year or two nationally, mostly because of low fuel prices and an improving economy.
"When the economy rebounded, people purchased vehicles again, which they want to drive," said Andrea Packer, UTA communications director. Whenever gas prices drop, people tend to drive their own vehicles more instead of using transit to save money.
But Biles notes, "We've been helped by lower fuel prices, too," which have saved big money for his agency — even if they did hurt ridership numbers.
—
Efficiency • Data show UTA is efficient and holds down costs relatively well compared to similar agencies.
UTA's FrontRunner had the lowest expense per mile and hour of service offered among the commuter-rail systems surveyed. TRAX was lowest in expenses per mile of service offered, and third lowest per hour of service in operation.
UTA bus costs also were relatively low, but not the lowest. They ranked third best (out of 18) in expense per mile of service offered, and fifth best for hour of service in operation.
"We've worked really hard on being efficient," Biles said, adding it saves taxpayers money and helps the agency to provide more overall service.
—
Challenges • While UTA seeks to boost ridership, big improvement may hinge on some pricey action that Biles says the agency can't afford for now — including adding more night and weekend service, more frequency and expanding areas served.
Biles said the agency was able to use a tax hike from Proposition 1 — approved in 2015 in Davis, Weber and Tooele counties — to add 14,000 hours of such improved service there. "In those areas, we've mitigated some of that decline" in ridership, he said.
But such expansion did not occur where Prop 1 failed in the state's two most populous counties, Salt Lake and Utah, as well as Box Elder, largely because of shaken public confidence over scandals related to high UTA executive salaries, vast international travel and sweetheart deals with developers.
UTA made a deal this year to avoid federal prosecution by agreeing to work with prosecutors in probes of former officials and past land deals, and by agreeing to three years of federal oversight.
The agency says it is trying to build trust for possible future tax hikes. Biles said putting out data comparing UTA to other agencies is part of that effort. "It's important to provide information so the public can take a look," he said.
Until more revenue comes its way, Biles said UTA is doing the best it can with the resources it has — and is trying to find ways to change routes to carry more people.
An example, he said, was reworking ski bus service last year. UTA dropped some direct routes from downtown Salt Lake City, urging skiers to use other TRAX or bus routes to get from there to mountain canyons. That allowed increasing frequency of ski buses in the canyons.
It had "significant impact with a 26 percent ridership increase," said Nichol Bourdeaux, UTA vice president of external relations.
Biles said UTA is looking to replace or combine little-used routes to fund others that would be in higher demand.
"We're going to be working on those things: How can we be more cost efficient? How can we reconfigure some of our routes to get better ridership?" he said. "We're trying to balance several factors. Frequency typically results in higher ridership. But is that the best use when we're also concerned about coverage, which is area as well as hours?" —
UTA compared to similar agencies, 2016
• Bus passenger trips per mile or per hour of service: second worst among 18 similar agencies.
• Commuter train (FrontRunner) passenger trips per mile or per hour of service: second worst among 11 agencies.
• Light rail (TRAX) passenger trips per mile of service: third worst among 10 agencies; per hour or service, sixth worst.
• Commuter train (FrontRunner) operating expense per mile or hour of service; best among 11 agencies.
• Light rail (TRAX) operating expense per mile of service: best among 10 agencies; per hour of service, third best.
• Bus operating expense per mile of service, third best among 18 agencies; per hour of service, fifth best.
Source: "Comprehensive Annual Financial Report" by UTA.


