

This is an archived article that was published on sltrib.com in 2012, and information in the article may be outdated. It is provided only for personal research purposes and may not be reprinted.
The sea of data we swim in gets deeper and broader every year as the digital age exponentially expands our ability to measure, record and transmit information.
And like a real sea, all this knowledge can nourish the human mind. Or drown it.
Our ability to generate data is far outstripping our ability to do useful things with it, says Miriah Meyer, a University of Utah computer scientist who is on a mission to tame the beast called Big Data.
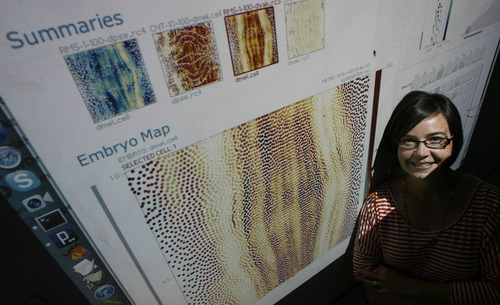
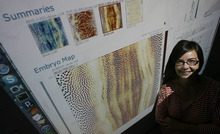
Meyer, who joined the Scientific Computing and Imaging Institute, or SCI, last year as an assistant professor, is reinventing the way scientists process data. She wants to replace scatter plots with interactive color-coded graphics to help scientists elucidate the truth.
To that end, she hangs out in biology labs, learning about the big research questions in the life sciences and designing ways to visually massage data into answers. Her work is about building algorithms that reveal meaningful patterns.
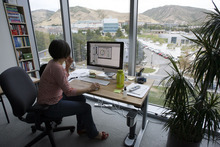
"The less time they think about the tools, the more time they can spend on their science," Meyer said. "I work hard to get into the heads of my collaborators."
U. President David Pershing identified Meyer as "one of our rising stars" while introducing her to a standing-room only audience this month at the Gould Distinguished Lecture on Technology and the Quality of Life.
Others agree Meyer is on to something. Fast Company magazine pegged her at No. 24 among the 100 most creative people in business (behind Skillshare's Michael Karnjanaprakorn, but ahead of Bjork), while Technology Review named her among the world's top innovators under the age of 35. Then last summer she was named a 2012 Microsoft Research Faculty Fellow, which honors seven scientists for advancing computing research.
—
Defined by data • "Data is one of the defining aspects of this moment in time. Access to data affects the way we work, play and make decisions," Meyer told her Gould audience at the U. Marriott Library.
During all of history through 2003, humanity generated 5 exabytes of data, she said. Less than a decade later, we generate more than that every day. (An exabyte is one billion gigabytes, aka a quintillion bytes.)
"In .02 seconds we generate the amount of data stored at this library," Meyer said. "A large part is coming from researchers. Scientists and scholars are looking to this data to unveil the mysteries of the universe, cure disease and help us live healthier and happier lives."
But all this data could be confusing rather than enlightening us. As a cautionary tale, Meyer cites the NASA engineers who warned space shuttle officials about the hazards of a cold weather launch in January 1986 as the Challenger was being prepared for a mission. Their predictions of O-ring failure went unheeded, and the Challenger exploded over Florida, 73 seconds after liftoff.
The engineers' inability to persuade officials to postpone the fateful launch was really a failure to present their data in a way that made immediate sense, Meyer argues. Visualization could have prevented the tragedy that cost seven astronauts their lives.
—
Seeing science • Meanwhile, other young U. researchers are turning to visualization to coax insights out of reams of data.
Bryan William Jones, a neurologist at the Moran Eye Center, processes photographic data with algorithms used in spy satellites to convey the extreme diversity of light-receptor cells in the retina.
"Our lab wants to know more about the retina because it's hard to fix when it goes bad. Cells are wired together in specific ways but we don't know all the connections," he said last month at the Leonardo, where he joined Meyer on a panel about information overload.
When he began his data-intensive retinal research, the hard drives necessary to crunch the numbers would have cost $50 million. But the technology has since caught up and his research is bearing fruit — and stunning pictures. His image of a mouse's eye recently won best photograph in the American Association for the Advancement of Science's annual visualization challenge.
Meyer and Jones argue that human memory and cognition are limited. The goal behind visualization is to harness perception to see patterns in data, freeing up cognition to analyze what they mean.
—
A professional curiosity • Meyer studied astronomy as an undergraduate at Pennsylvania State University, but it took night classes she took for fun after graduation for her to discover computer science.
"In my heart I like to make things rather than study things," she said. Computer graphics became her bridge between design and scientific inquiry. Meyer earned her doctorate in computer science at the U., which has a rich history in graphics and left in 2008 for a postdoctoral research fellowship at Harvard.
What makes her so valuable in computing is her broad background in science and her driving curiosity to learn more, according to SCI Director Chris Johnson.
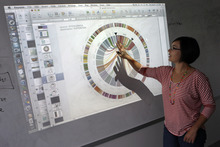
In Cambridge, for example, she helped MIT comparative geneticist Manfred Grabherr visualize key aspects of a lizard genome with a tool they call MizBee, another way of saying "multiscale synteny browser." The tool features side-by-side linked views of color-coded genetic data across scales, from the genome (the whole book) to the gene (a single word).
"This is a great example of where the collaboration between a visualization researcher and a geneticist was able to solve a problem that neither could have solved by themselves," Johnson said.
Last year, Meyer enjoyed 13 faculty offers from prestigious schools and settled on the U., where she is now part of USTAR, the state's program to commercialize promising technologies arising from university research.
"There is a long list of people who want to collaborate with her," Johnson said. "Her big challenge is to scale her amazing talents to work with more people" to have the biggest possible impact.